

This article is the first in a multi-part series on how to enable performance testing to fit into continuous and automated pipelines seamlessly.
Part 1: Continuous Load Testing using Jenkins Pipelines and Kubernetes
Part 2: 3 Killer anti-patterns in continuous performance testing
Part 3: Accelerating performance analysis with trends and open API data
As organizations become more automated in their approach to software delivery, many teams struggle to fit traditional feedback loops into their continuous delivery lifecycles. “How do you test all the things all the time” is a classic (albeit early) question people ask. Testing is just a tactic, and the more critical focus needs be on where/when/which feedback loops should be in place (within the context of automated pipelines at least).
Consider load testing, a mechanism to verify the scalability and performance of distributed software systems, which used to require time, expertise, and often always-on infrastructure. The feedback is vital, but the cost of gathering it used to be too high to fit into high-velocity software delivery. Not so anymore.
What does load testing have to do with continuous delivery?
Unless you want to continuously deliver disappointing software that causes more trouble than it’s worth in production, consider that there are many tools/techniques that the past 70 years of software engineering have already produced to prevent this unfortunate future. One of those is load testing distributed systems before (and after) deployment.
Load testing is simply a technique for understanding your system better, causing it to exhibit issues in misconfiguration, architectural assumptions, and resource constraints. Types of load tests range from low-volume system checks to full-blown soak tests that take most of the day.
But how do you make time for this during busy sprints and deployment schedules? And what does it take to do this continuously without incurring delays/waste on your value stream? The answer is twofold:
- Removing blockers to running these tests
- Making the results visible, actionable, and transparent
Let’s start with the first automation blocker.
Step 0: Get your ducks in a row
Before diving into technical specifics, it helps to have a few requirements fleshed out ahead of time. In our field experience, common performance automation blockers include:
- Inconsistently available systems or environments to test: You can’t test an app/service that you can’t contact, so in many cases this means having “performance testing target environment” in the project plan.
- Performance criteria intake process: Sometimes this can be as simple as a form of questions about the systems and timeframes that performance testing should target.
- Results analysis and an action response plan that all teams, not just the performance engineers, agree to uphold. Unless it’s fixing issues, what’s the point of testing?
- Precise system performance and reliability expectations described as Service Level Agreements (SLAs), Objectives (SLOs) and Indicators (SLIs), also known as monitoring metrics.
Having these “entry criteria” ironed out before embarking on continuous performance testing reduces miscommunication, delays, and otherwise cross-team dysfunction. When they’re in place, we’ve seen enterprise teams of as many as 10 performance engineers supporting hundreds of application and service teams. If you’re not there yet, that’s cool, and exactly why we want to bring you lessons learned while putting load testing into serious practice.
Step 1: Choose a “hardware” paradigm that fits continuous delivery
Load testing requires hardware resources that are isolated from the system under test (SUT) to provide unbiased, objective measurements of system performance under pressure. In performance-speak, these are usually called “load generators”; they split up the responsibility of putting lots of pressure on the SUT, allowing a master “controller” to orchestrate/consolidate real-time results during a test.
The problem with traditional always-on infrastructure in continuous delivery (in any type of limited-number automated process such as Jenkins node building) is that you eventually run out of static resources if the demand gets too high. Do you have too many concurrent build triggers because feature teams possess high velocity? That’s unfortunate; fail the build if resources aren’t available because someone else is using them. This anti-pattern multiplies if you need a few resources per build, such as multi-service test environments or multiple load controllers/load generators merely to run a test.
Fear not, there are two alternative approaches to this resource race condition:
- Reserve and queue resources — in my opinion, an anti-pattern that gets in the way of delivery
- Dynamic provisioning using automated resource descriptions
For many Tricentis NeoLoad customers, making the switch from always-on static load generators to dynamic only-when-needed infrastructure with traditional virtual machines (via VMware on-prem or cloud-based solutions such as AWS EC2, Azure, or Google Cloud) can have the following effects.
- It takes too long to spin up, on the order of minutes.
- It often requires bespoke manual configuration and repackaging every time even a small part of the software versions change.
Alternatively, container-based solutions such as Docker and Kubernetes launch in seconds and are fast to update/publish new versions to a container registry like Artifactory. Reason being, instances of packaged software called “containers” layer image volume deltas. In this case, containers exist mostly as instance metadata and volume data on top of Linux system core modules at the container host level. It’d be like VM incremental volumes on steroids, but with greater syntax sugar and semantics for automation engineers.
In this model, teams use a script like a Dockerfile to describe what a canonical load generator would look like in terms of software components, possibly even how it would be spun up with other load generators/controllers in a Kubernetes Deployment file.
Step 2: Establish a relationship with your container provisioning team
Unfortunately, many enterprises have synthesized “DevOps” as “that department of SysOps engineers doing the cloud stuff; everything else other teams don’t understand.” Wherever you are on your Agile, DevOps, or overgrown software forest journey, and however your organization decides to consolidate expertise in particular areas, a stable relationship between people who need containers in a pipeline and those who provision with Kubernetes is critical to implementing load testing on dynamic infrastructure.
In many situations, cloud and SysOps engineers espousing a DevOps approach to meet agile consumers formulate as service teams tracking their work using similar methods of organizing work patterns into predictable outcomes. “Feature work” or on-call duty is well documented, prioritized, and followed in sprints and on Kanban boards, requiring consumer requests to be well formed and scheduled. Understanding what intake patterns your sibling engineering teams employ is critical to encouraging effective communication and collaboration.
Case study: Dynamic infrastructure in the Fortune 100
I’ve had the pleasure (and pain) of working with quite a few large organizations since mid-2018, implementing load testing at scale in the Jenkins pipeline using Kubernetes. Some have OpenShift, while others incorporate a homegrown approach via Rancher and VMware.
For one organization, the first hurdle was the pipeline orchestration itself, in that Jenkins on CloudBees Enterprise could provision containers for automated build steps, but only one container at a time through the Palace plugin (in their “production” Jenkins environment). Single-container builds serve well as a way to package software in a sequential fashion using Docker-in-Docker (DinD) build nodes but break down quickly when your task requires multiple containers such as load controllers/generators to work well. “Sidecar” containers also proved infeasible and cumbersome to manage effectively.
Their second hurdle (and ultimately the solution) was to switch to a newer non-production environment that supported the Kubernetes plugin for Jenkins, typically used to test new plugin versions and other experimental automated processes. Doing this required the development of a working relationship between performance engineering and the cloud/DevOps provisioning teams. With a proper multi-container templating solution, the lead engineer was able to build reliable load controller/generator models for use in pipeline scripts. In the process, she learned how to effectively modify Dockerfile templates to shim corporate CA and intermediate security certificates so controllers could exchange load testing results with Tricentis NeoLoad. This way, every load test in these pipelines would produce useful, real-time performance results for app and service teams to make important decisions about the release readiness and quality trends over time of their products autonomously.
Another organization already had a container orchestration platform, OpenShift, to solve these problems. Leadership had dictated that all new automation should use this platform to consolidate resource usage and reduce the cost of traditional always-on hardware expectations. However, having to write provisioning templates and rules was not a hurdle they were prepared to overcome short-term.
The solution was to work closely with them to develop native OpenShift support for NeoLoad Web Runtime, their preferred method for executing load testing suites stored in Gitlab. Additionally, REST API support to trigger this process provided the performance and automation engineering teams the freedom to extend performance feedback loops to their app and services teams as a service, without having to become Docker and Kubernetes experts overnight.
With this freedom, performance engineers embedded within various app/service teams could get to the critical work of matching testing with dev cycles instead of managing hardware resources. This resulted in cross-functional teams working more closely, finding unanticipated service mesh and architectural issues early during the implementation phases, before “forklift” system migrations.
Step 3: Build useful information radiators for development and operations
As development and operational cycles shrink to days, not weeks, real-time feedback about code/system changes becomes vital to integrate into in-process work, rather than to leave lengthy testing cycles to the end of sprint work. Smaller batch sizes mean that both code and test work optimally happening together, preserving the context of the work to apply for both motions. Realizing the benefit of this work requires an easy, autonomous method of writing, running, and analyzing outcomes of tests in those same cycles.
For continuous load and performance testing, “useful information” in real time includes the following data:
- Load infrastructure health to ensure no bias is introduced into test results
- Transaction duration, throughput, and requests per second
- Resource utilization in various components of the system under test
- Measurement of the effect of pressure on the end-user experience
In DevOps, the term “information radiator” means a visual representation of metrics that are critical to making decisions about system reliability. Agile also uses this term to describe managing the status of work items as they flow through human and automated processes.
For performance engineering, there are a few critical aspects for load testing information radiators, namely:
- Detailed reporting and data drill-down on a per-test basis (test results)
- Trending of transaction and system responsiveness over time
- Integration with other platforms (e.g., OpenShift) to efficiently execute tests
- Always-available access to this information by all teams and stakeholders
An example of detailed reporting from NeoLoad Web is shown below, including load aggregates, system health, and end-user W3C performance times from Selenium:
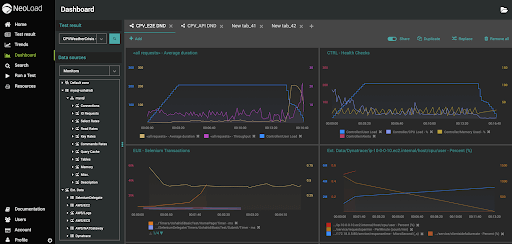
These dashboards can be constructed and shared either per team or across the organization. On-premises LDAP support also enables organizations to provide access to approved personnel.
Additionally, trends in transactions and request rates, particularly useful for APIs and microservices, provide a quick way to determine if technical performance debt is accruing over time:
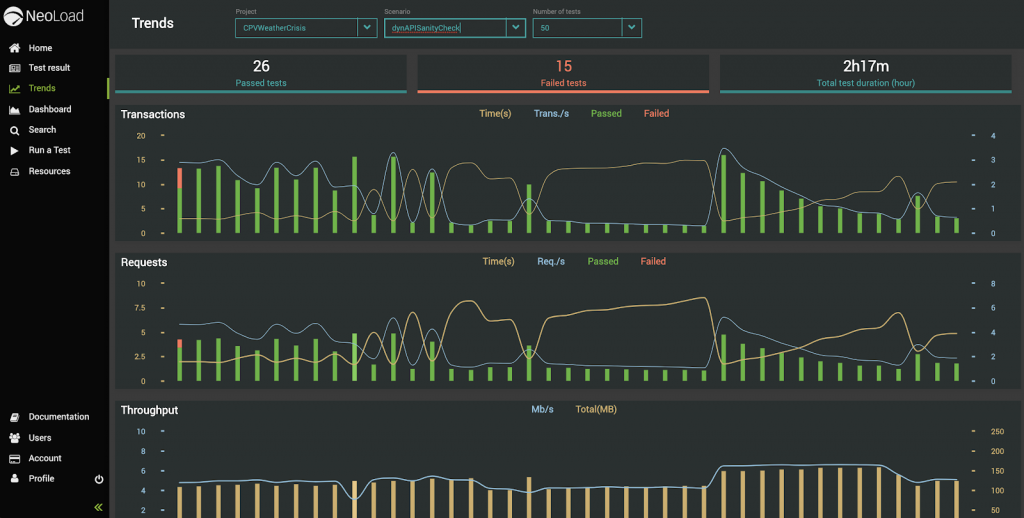
By making this information available and promoting it as part of go/no-go automated decision processes, teams can find the right fit for which systems and components to focus their attention on.
Now: Start small, build confidence
Figuring out which systems and components need continuous feedback doesn’t take one individual; instead, it requires conversations with your teams/engineers. Picking the right candidate for continuous testing and building reliable test processes is covered in detail in my white paper A practical guide to continuous performance testing. For now, I encourage you to ask yourself, “Do we have the elements from Step 0 in place today such that we can have a productive conversation with team X?”
That said, select a system, API, or service that is critical to your line of business, maybe one that you feel lacks visibility on performance, scalability, or reliability. It’s likely you already know which systems have experienced unexpected downtime or have been identified as high risk in planning processes. Note who “owns” this system, not just in production operation but in development and on the business side. They’ll probably be stubborn about where and how proper performance feedback loops can positively impact their work.
Next up
In the next article, 3 killer anti-patterns in continuous performance testing, we drill down into why things like a lack of Git/versioning, promotion strategy, or “root cause” are killer anti-patterns in continuous performance testing.
And in the final article of this series, Accelerating performance analysis with trends and open API data, we look at what putting continuous performance practices in place gets you. In short, better systems, faster fail/fix cycles, and less technical debt.
The post was originally published in 2019 and was most recently updated in July 2021.