

Getting started on your automated performance testing journey can be daunting if you don’t start in the right place. You need to pick the right target, which in the case of many Tricentis NeoLoad customers starts with APIs. You might have dozens of teams that eventually need performance feedback loops in their delivery process, but starting small and building on your successes is key to changing the status quo.
In many cases, enterprise-scale organizations already have a huge backlog of APIs and microservices that aren’t yet covered by performance (or non-functional) testing. APIs also represent a much smaller “surface area” to test in terms of complexity and SLAs. Some APIs are independently managed and deployed, making them easier to test than, say, APIs exposed by a big, shared enterprise service bus (ESB).
There is almost always a cross-section of APIs in your organization’s portfolio that are easy targets but also on a critical business path in terms of revenue or risk. It is with these services that you should focus on as immediate initial targets for building out continuous performance feedback loops.
Teams that already have something deployed and ready to test, either in lower environments or in production, are a great place to begin. These teams might also be ones that performance engineers already have a relationship with. If so, obtaining architecture diagrams, getting access to monitoring tools, and establishing proper performance criteria early in sprint work would already be anticipated and pretty straightforward.
How early is too early for performance testing APIs?
Back in the day, a tester would ask a developer, “How can I test something you haven’t built yet?” In response, the developer would shrug and say, “Our unit tests are good enough for now; let’s wait to do all that non-functional stuff until we get a staging environment.” The unfortunate reality is that engineering teams don’t have the luxury of being told to waterfall the process anymore, not to mention defer questions of testability and proper requirement gathering to “later.”
The good news is that it’s been over five years since the API descriptor wars finally resulted in the industrial standardization of the OpenAPI specification format. If the API team behind your system hasn’t documented and described their API in this format, shame them (a little). After that, you’re still left with the need to script and run tests. But there is a wealth of options these days for setting up semi-representative target systems so that you can do most of the scripting work early. Then, when a real system is deployed to a staging environment, you can simply point tests to that new environment.
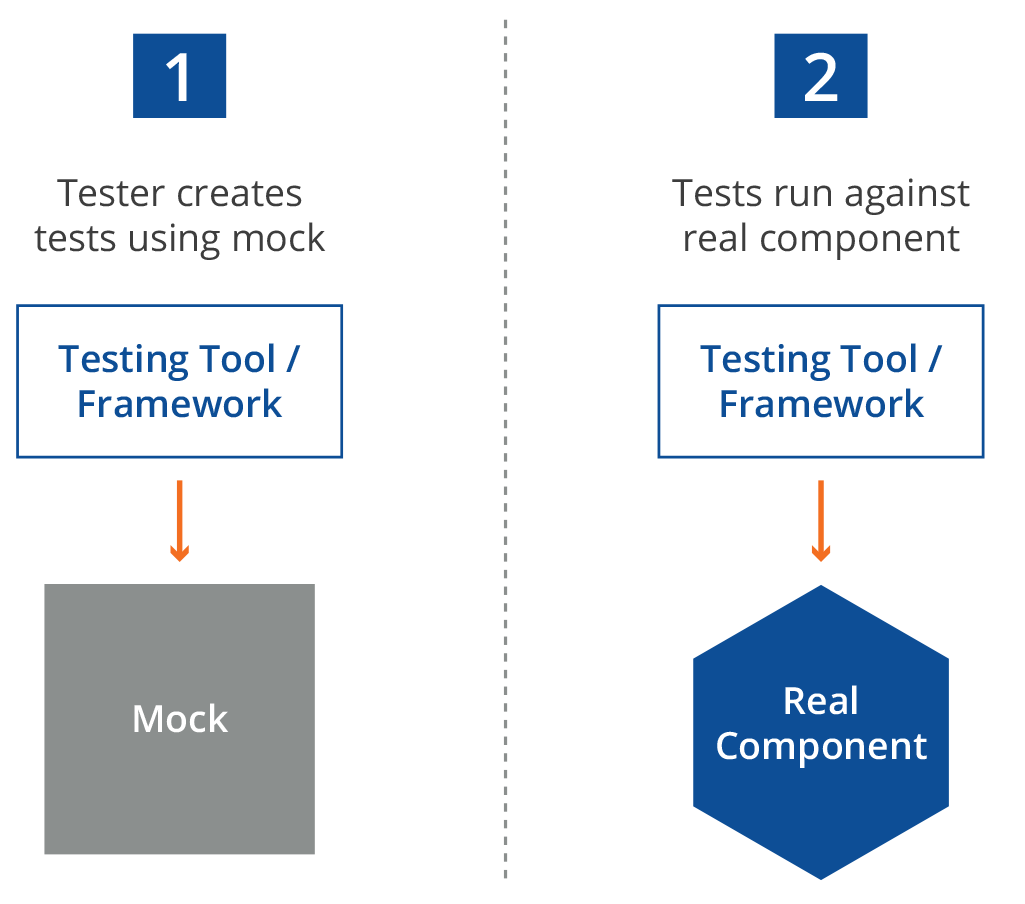
One common practice when left-shifting feedback loops is to mock out dependencies. In the case of APIs, you may want to write your tests so early that the actual API isn’t deployed yet. Many organizations use service virtualization for fault isolation (removing specific third parties from integration testing) but fail to realize how useful API mocking is for the process of creating test suites before the actual APIs are deployed. This practice accelerates the process of including performance feedback loops simply by having automatable test assets ready to go before the actual automated testing process needs them. In fact, some performance teams have even created their own open-source tools, such as Mockiato, to make this part of their daily agile testing practices.
It’s rarely too early to think about software testing, or expect that performance requirements are in order, before moving on in development cycles. But you must be “in the room,” during these early PI and architecture meetings. Don’t expect that others are going to capture and document what is needed to know to test earlier.
Develop performance pipelines
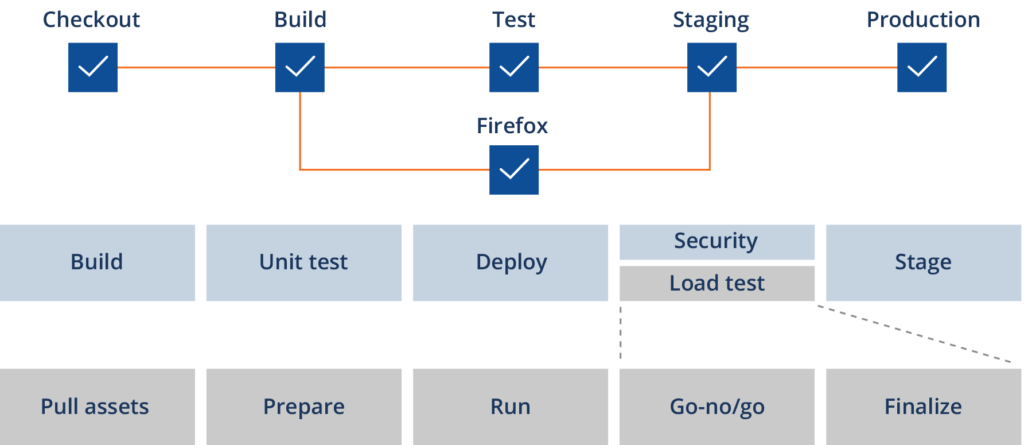
Creating a few automated pipelines specifically to run performance checks is another good place to begin. Rather than assuming the delivery pipeline is one big monolith, separate jobs or pipelines for specific post-build, longer-running test processes allows teams to decide when to trigger them (e.g., not on every commit/push, but upon pull requests and before significant merges). Separating pipeline stages like this also allows you to run and re-run the load testing process if and when everything compiles and deploys properly but performance SLAs fail due to misconfiguration or environment issues.
At NeoLoad, we work with scores of Fortune 500 companies and have to integrate into many different CI/CD pipeline systems. At a large organization, it is not uncommon to have a mix of multiple technologies to do this. The good news is that we don’t require specialized plugins or administrative access to run performance tests in pipelines . . . you just need our command line interface. You can find examples for implementing NeoLoad in a variety of CI platforms here.
The goal with these early milestones is to provide useful, frequent feedback on performance thresholds that the team agrees are reasonable checksums of how the code itself should be performing at small scale. This is a non-disruptive quality signal that lets the team and product owner get a sense of which areas of their architecture, code, and environments they will likely need to allocate time to address, before leaving it to the late stages of the delivery cycle. With a clearer sense of non-functional requirements (NFRs) from this work, teams can more confidently set up the proper production environment, monitoring and alerting thresholds, and maybe even start constructing service level objectives (SLOs) that align with business goals.
Growing your successes into an organization-wide approach
Every day, our Customer Engineering team is helping NeoLoad customers go from small, isolated successes to widely adoptable approaches that are approved by architecture review boards (ARBs) and implemented by hundreds of teams at large organizations. In our experience, enterprises that have successfully adopted a performance engineering approach across the entire organization share these elements:
- Clear criteria for when various types of performance testing are required
- A description of services provided by performance subject matter experts (SMEs)
- Documentation for how to engage SMEs and utilize the testing platform
- A performance requirements intake process, preferably online for teams to submit
- Repos for sample pipelines, performance test suites, and reporting templates
- Invitation for onboarding/training and a regular-cadence roundtable where teams and SMEs meet to discuss successes, gaps, and future improvements
- A deployment and management plan over the testing platform and infrastructure
We often find that top-down organizational mandates are less in vogue than providing a preferred approach to performance testing while also having SMEs retain some knowledge and skills over other approaches that teams might take independently. Though it puts more short-term pressure on SMEs to support multiple tools, processes, and training needs, all organizations are in constant flux. Approving a preferred approach but also allowing teams to come as they are with what they have provides flexibility while also steering the ship towards a more scalable, supportable long-term model.
Layering in best practices and guardrails
As teams begin to engage SMEs and define performance requirements, it also helps to have scalable knowledge (particularly on deep technical details) stored somewhere like a wiki. Articles on “how to configure Apache” or “best practices for tuning the JVM” go a long way to ensure that development and release engineers not write poorly optimized artifacts, deploy them, and find out the hard way that their special snowflake service isn’t scalable under load.
There is a lot of performance tribal knowledge that can be distilled into articles like these. They give product teams license to implement these “good practices” autonomously without swamping the limited number of SMEs in an organization. A few other topics we’ve regularly seen in mature organizations’ compendium of knowledge:
- How to configure load balancers and network ingress controllers
- How to write and run simple API load and stress tests
- How to request security firewall exceptions between servers and services
- What and how should I monitor:
- In my service, operating system, and network
- In my control plane (e.g., Prometheus for Kubernetes clusters)
- In batch and queue scenarios
- In my data plane/store
- How to implement performance testing in CI pipelines
- What performance dashboards different teams should look at during daily standups
Once teams start to implement samples and adapt them to their needs, the SME group will often want to seamlessly inject SLAs and additional monitoring processes on top of what the product teams use to performance test. NeoLoad makes this absurdly simple, particularly in CI pipelines, by:
- Using shared libraries or frameworks to simplify pipeline code
- Allowing additional testing artifacts to be layered into those shared functions
- Training and coaching the product teams on how to better analyze results
This gives rise to the notion of guardrails — or SME good practices — that are distilled into testing artifacts and templates so that SMEs don’t have to repeat the same toilsome tasks across hundreds of teams and performance pipelines. This is at the heart of modern site reliability engineering in mature organizations . . . “How could I automate this thing someone keeps asking me to do?”
We have also seen additional homegrown tooling implemented before and after performance test pipelines run, such as automated environment configuration comparison utilities, chaos injection (such as with Gremlin) to prove that load balancing and pod scaling in Kubernetes works as defined, and custom baseline comparison and trends reporting that runs after every load test. These guardrails help product teams by not requiring them to be experts at performance testing process details, but still providing them the deep insights they need to take early action and keep their product delivery cycles free from late-stage surprises.
How NeoLoad accelerates your performance adoption journey
NeoLoad provides a number of ways to start API testing. Either via our Desktop Designer or via additional command line interfaces, you can quickly import OpenAPI specs, Postman collections, or write tests in our YAML format. Once these tests are written, you can run them in NeoLoad Web or directly from the command line to get fast and simple performance feedback.
NeoLoad supports multiple monitoring strategies, whether it’s integrating with tools like Dynatrace, AppDynamics, NewRelic, and other APM platforms; direct monitoring of specific servers and processes; or through container control plane monitoring solutions like Prometheus. Getting the impact metrics of the pressure your load test puts on systems is minimum-viable in load testing speak.
The NeoLoad CLI (command line interface) also supports all major CI platforms and provides rugged backwards compatibility so that you can embed it into your pipelines with confidence that it will work as designed for years to come.
Additionally, NeoLoad Web provides a consolidated approach to managing performance test results data, including default reports, customizable dashboards, and test-over-test trends. There is also a complete REST API that allows you to download performance test result summaries and raw data so that you can integrate these results into any existing process or tooling you currently use to analyze performance data.