


Load and performance testing remains a vital aspect of any software delivery process. Ensuring that your application supports the anticipated number of concurrent users prevents brand damage, system failures in production, and loss of revenue.
There is a saying in engineering that the shape of the solution is dictated by the shape of the problem. Translating this to performance testing solutions, there are several common design elements that all load and performance testing solutions share.
- First, there are virtual users. A virtual user is a software program executing a test script, pretending to be a real user. The program sends messages to the web server, deceiving it into believing that it is in all ways a real user. When you run hundreds or thousands of these users at the same time, running multiple different test scripts, you have a performance test.
- Second, there is a central command and control console that manages performance tests. In Tricentis NeoLoad, we developed the NeoLoad Controller, a software component that runs on your desktop or is started dynamically in NeoLoad Web. When running a test, the Controller coordinates the virtual user activities and collects result data as the tests execute.
- Third, there are hosts for virtual users. Because a virtual user is a software program in and of itself, it therefore requires mostly memory and processing power to execute (though disk and network are also factors to consider). In NeoLoad, we developed load generators that can be statically or dynamically created based on customer preferences. Principally, a load generator exists to allow solutions like NeoLoad to scale laterally, adding more CPU, memory, and network bandwidth to host more virtual users. The larger your test, the more load generators you need.
So why can’t my vendor tell me how many load generators I need to run a test?
Performance tests operate based on a definition often referred to as a scenario. Unlike more traditional unit or functional tests, which have very firm criteria about what constitutes success or failure, performance testing requires all the scripts to execute simultaneously and loop continuously for the duration of the test. This creates a spread of disparate user behaviors on the system for extended periods of time, emulating production load and allowing teams to observe the system under test to determine if it is performing to expectations or not.
However, the scenario itself is highly configurable, allowing testers to vary the number of users, the rate of execution, and many other factors. Due to the high number of configurable elements, it becomes extremely challenging to understand how many resources are going to be required to run a test.
Failing to have adequate resources leads to the introduction of artificial bottlenecks. A bottleneck is the point in a system where the load being generated cannot be serviced faster than it is arriving, resulting in a system failing to perform to expectations. An artificial bottleneck is where this failure point exists not in the application under test, but in the load and performance testing solution being employed. The primary reason that NeoLoad always monitors the controller and load generators during a test is to ensure that any performance issues are not related to the platform you used to generate the test.
The four most common elements that define the limits on how many virtual users can be run on a given load generator are how much memory, CPU, network bandwidth, and Disk I/O will be required.
Memory
Memory is perhaps the easiest to quantify. When a virtual user comes into existence as a test is started, it is assigned a specific test script to execute. The scope of this test, or the path of the user through the application, has a nearly 100% impact on the size of the virtual user in terms of the memory required to host it. The larger the scope of your test script – and the more complex the underlying application – the larger the amount of memory a virtual user will need to run the test script from start to finish. Remember, once complete, the virtual user will restart the test script, looping through it over and over to drive a consistent number of users for the duration of the test.
Your vendor has no insight into what size scope you plan to build into your performance test scripts. Nor do vendors understand the underlying complexity of the application that can require additional memory to host dynamic content, large images, multiple variables and other logic, and so forth.
Memory-based artificial bottlenecks manifest in one of two ways:
- First, and most likely, the system will begin leveraging virtual memory. When RAM becomes exhausted, the operating system will begin using the disk to read and write instructions. The disk is much slower than RAM, and results in a sharp spike in CPU consumption. Once a test begins using virtual memory (or swap memory), your test results are essentially invalid.
- The second way this manifests, usually when virtual memory is exhausted, is when the operating system protects itself from memory exceptions by terminating the offending application. More succinctly, the operating system will kill the load generator when it asks for more memory than is available. Your test obviously comes crashing down at this point.
CPU
Determining how much processing capacity is required to run a virtual user is not nearly as linear as that of memory. Similar factors, such as the complexity of the application, have a larger visible impact on CPU consumption as the application components like JavaScript are often required to be executed as the test progresses. However, unlike memory which remains relatively linear, CPU is dramatically impacted by scenario design inside your scenario definition.
All performance testing solutions can pause execution to simulate the user observing the application. When you as a user navigate to a web page, even if you are incredibly familiar with the site, a basic interaction still requires you to move your mouse to a specific place and click to drive to the next step. This time spent positioning the mouse or entering data into fields is called think time. Think time represents the difference between realistic user interactions with a system and brute force executions that share many characteristics of distributed denial of service (DDOS) attacks.
For example, imagine a warehouse application where the employees use a hand-scanner to scan a barcode printed on a product, retrieving information like price, quantity, materials, and more. How would such users interact with their software? They would walk to a particular item, locate the barcode, scan the code, wait for the information to display on their device, and then read that information. The think time added to your scripts represents the time spent walking and locating the barcode, and then after the transaction the time spent viewing the information. A test without user think time represents the worker sprinting down the aisle, their barcode scanner pointed outward, scanning every item as they rush past.
Driving load against a system without user think time means the CPU execution is consistently high, without pause, across all virtual users. The demand this places on the load generator is substantially higher than it would be if there were think time pauses in the test, at which point the CPU load from that virtual user drops to essentially zero. The impact on the scalability of a load generator is enormous.
Interestingly, the key metric to look for in order to determine whether or not you have an artificial bottleneck is not CPU consumption, but CPU queuing. It is acceptable – risky, but acceptable – to have your load generator running at 100% CPU consumption. However, when a request needs to be executed but there are insufficient CPU cycles to do so, it results in a CPU queue. While waiting for CPU cycles to process the request your performance results are still being timed, and artificially inflated as a result.
Think time represents merely one configuration that can have an outsized impact on CPU consumption on your load generators. We, as software vendors, have no insight into how you plan to run your tests.
Network
Your load generators have a network connection, and like CPU this can become saturated with data as you run a test. Historically, we find that network capacity dramatically exceeds CPU and memory capacity, so it is rare to find network saturation as a limiting factor on your test.
While all the factors in scenario design apply to network bandwidth, there are some nuances to understanding the view. Like CPU, it is not networking bandwidth consumption that is a core issue, but network queuing, with exactly the same ramifications to your performance test results. However, strange behaviors can exhibit here, where a 10-gigabit network card is plugged into a gigabit network. This can lead to situations where the network is completely saturated at 10% usage, since the limiting factor is not the network card (virtual or physical) available to the load generator, but the network it is connected to.
While rare, network queuing is still a major indicator that your test has introduced an artificial bottleneck and your results are being artificially degraded.
Disk
Following best practices, you should never be doing any sort of read or write operations from files as part of a performance test. Test data files required for your test are managed by the central command and control components and loaded into memory, instead of forcing a disk I/O action. Any performance test that includes disk read or write actions will almost immediately surface an artificial bottleneck.
A disk can also become saturated when you exceed available memory and the operating system reverts to using virtual memory on the disk. While this does cause a bottleneck due to disk activity, it is more properly addressed by ensuring adequate memory is available.
So how do I size my load generators then?
Each organization needs to determine this on a script-by-script and scenario-by-scenario basis.
Memory is easiest to understand and remains relatively linear throughout the scenario execution. To determine memory consumption for each test script, create a scenario using only that test script. Add a set number of users, then plateaus, then add a set number of users, and then plateaus again.
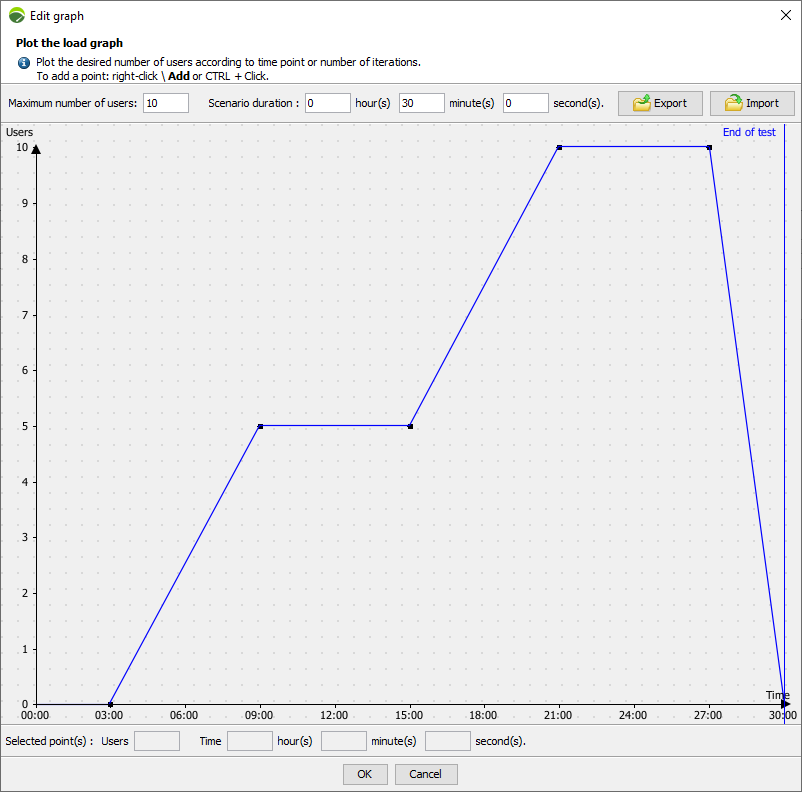
By examining system memory at each of the plateaus, you can determine the memory differential with a high degree of accuracy. In the above example, once the scenario begins zero virtual users are running for 3 minutes. During that plateau, sample the available system memory. When the next plateau of five virtual users is reached at nine minutes, sample again, and then again at twenty-one minutes when ten users are running. This yields a very specific metric that linearly applies, regardless of the load generator being used.
CPU is vastly more difficult to understand. Is your load generator being run on a physical machine? A virtual machine? A container? For those hypervisor platforms, what is the underlying hardware, and what other processes may be running on them? What is the difference in execution capacity between an Intel Core i9-10885H 2.40 GHz 8 core processor and an Intel Core i7-4790K 4.00 GHz 4 core processor in terms of CPU consumption of a unique test script for your unique application? How does that change if you modify the duration of think times in your scenario?
Unfortunately, the only way to understand this is through experiential analysis. As a recommendation, begin with smaller numbers of virtual users, watching the load generators themselves as the tests execute. You will learn over time how your infrastructure can scale to meet your needs.
As an example, you have five different test scripts in a scenario and wish to run a 500-user test, distributing the users evenly over those five test scripts (100 users on each). You are not certain how many load generators you will need, so you select two for the first run. Analysis during the test shows that the execution never moves above 30% CPU consumption at peak load. The next time you begin a test, you run a single load generator and observe CPU consumption never moving above 60%.
This process is not set in stone. As new components of your application are added, the application changes you are there to test can experience changes to CPU consumption of test scripts. New test scripts and scenarios can be devised. Your performance testing infrastructure may receive an upgrade to more powerful hardware. Continuously monitoring your infrastructure during a test run is vital to ensure that no artificial bottlenecks have been introduced into your test.
Network constraints mirror CPU, and occur so rarely that there is little additional detail that can be supplied beyond the guidance for monitoring CPU consumption. What is important to realize is that you may saturate the network with low volumes of traffic. Plugging a network card capable of 10 gigabits/second of network trafficking into a 100-megabit network will lead to artificial bottlenecks due to network saturation, but your network card in this scenario will only show 1% utilization.
Significant disk activity during a test is rare, but if you see it I recommend looking at memory – this is a strong indicator that the operating system has exceeded available RAM and is now using virtual memory. If you still have adequate memory, check the test scripts to see if there are any file I/O operations embedded within and remove them.
Final Thoughts
Sizing performance infrastructure can seem like a daunting task at first, but by simply observing and making incremental corrections, you can rapidly optimize this environment. Your vendor can and should be able to provide some process guidance to you, but ultimately your application and test strategy are unique to you, as will your load generator sizing and capacity metrics.