
Agentic Test Creation: AI-driven creation, analysis, and management
Boost release confidence with AI driven test creation that focuses...
Tricentis NeoLoad, the market-leading continuous performance testing solution, has just released version 7.7.
Tricentis NeoLoad, the market-leading continuous performance testing solution, has just released version 7.7.
Now you can generate standard performance reports “out of the box” directly from NeoLoad dashboards. The preconfigured reports are easily customizable, and data graphs can be exported as .csv files. For enhanced ease of use and greater security, logging in to NeoLoad SaaS login is now via Single Sign-on (SAML). NeoLoad now natively connects to your Prometheus monitoring system so you get all the relevant metrics you need for your performance analysis. And you can redefine existing Prometheus monitors with as-code variables to achieve a high-degree of automation.
The highlights in a nutshell:
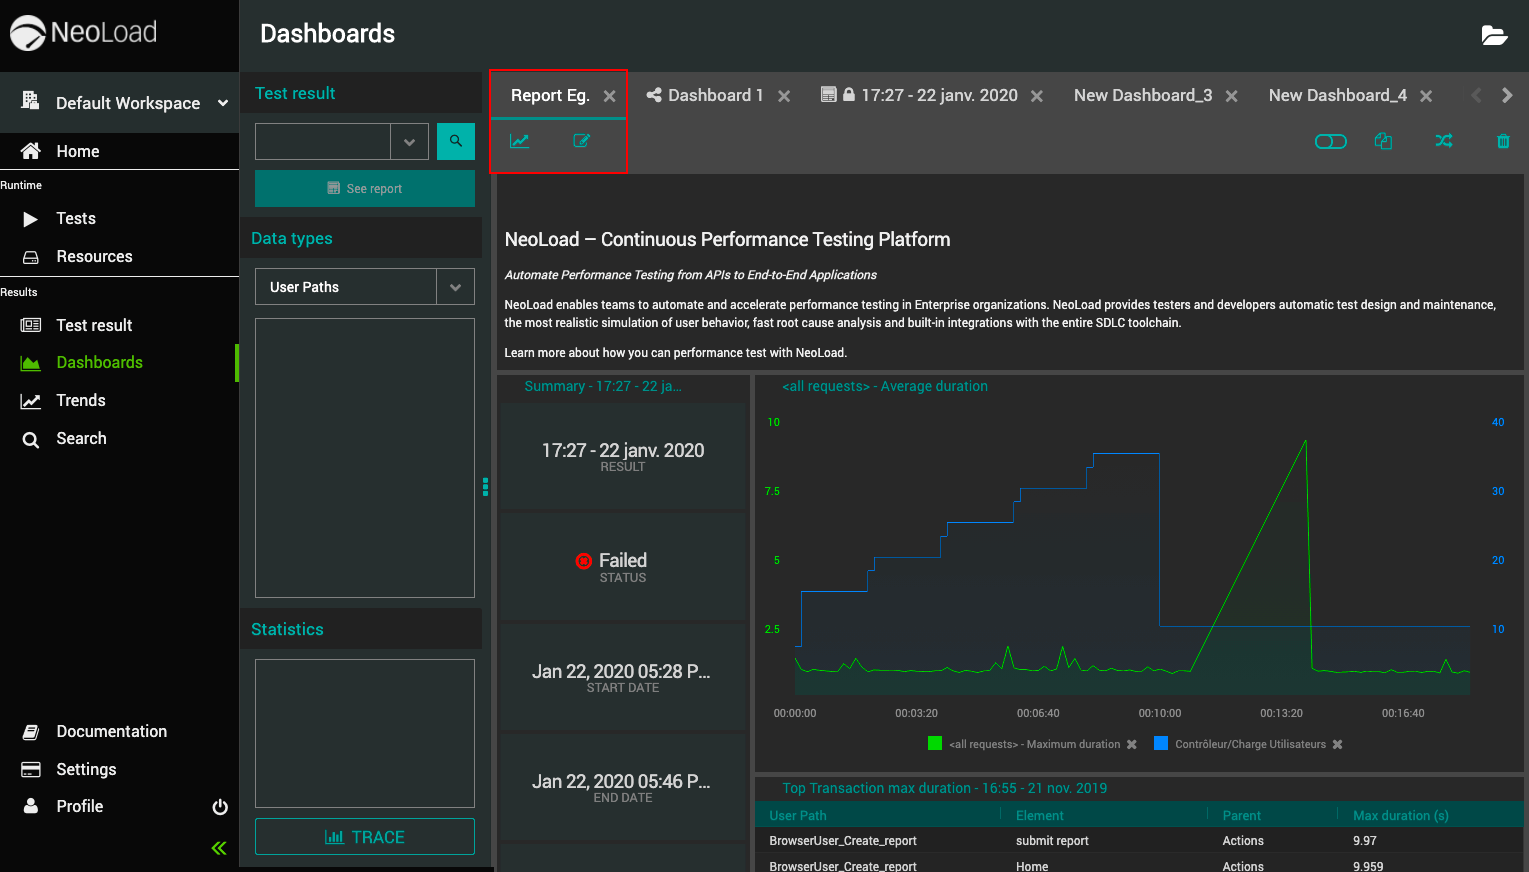
Standard reports are now available from the NeoLoad dashboard. You can access the standard, or “canned,” reports directly from the test overview or from the dashboards section. Once generated, the standard report can be customized.
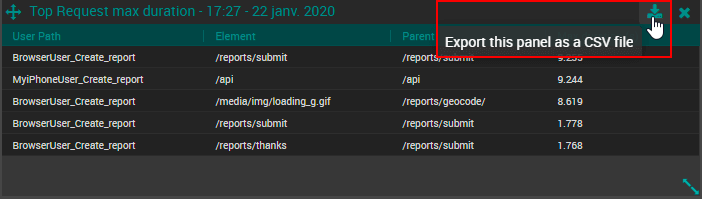
Export a data table into a .csv formatted file.
NeoLoad SaaS login is now configurable to use single sign-on (SAML). The login is also SSO enabled to access Tricentis NeoLoad portal (Tricentis Acadey, Support, etc.). If you are on a SaaS Enterprise plan, contact support to get set up.

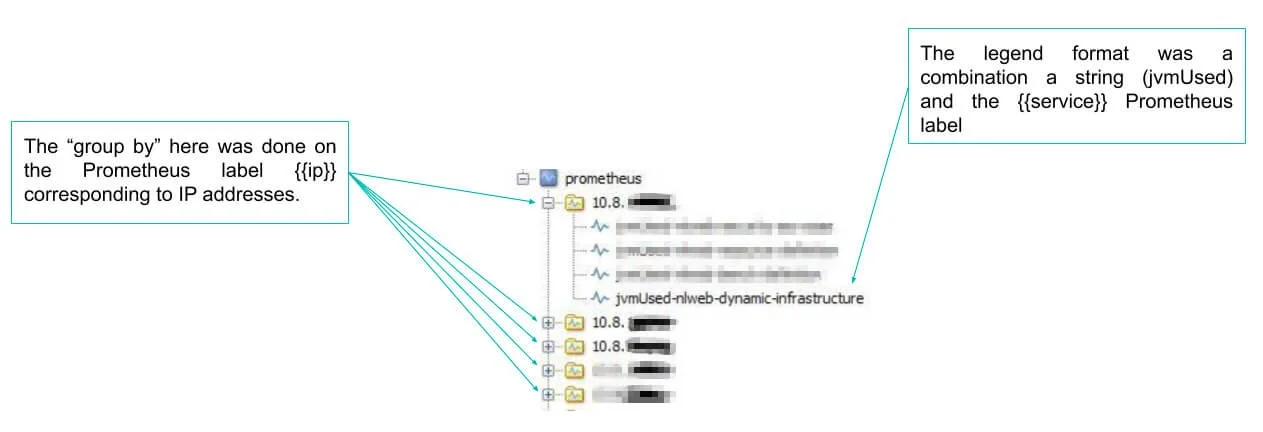
NeoLoad can now natively connect to your Prometheus monitoring system and get all the relevant metrics you need for your performance analysis. Create real-time visibility into multiple Prometheus requests in the NeoLoad Prometheus monitor.
Structure the values of your metrics with labels and legends to customize how you analyze the application.
Redefine existing Prometheus monitors with as-code variables to achieve a high-degree of automation.
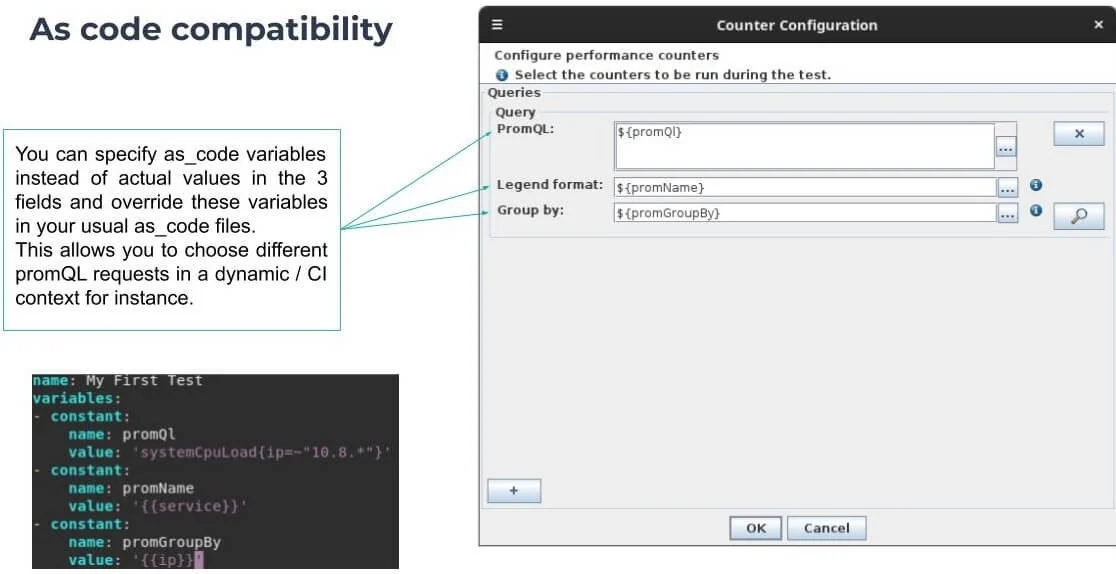
The promQL requests are resolved during the initialization phase of the run to define the counters list.
To avoid reconfigurations between test runs, you can now specify instances with matching regular expressions instead of picking them in the instances list. This is particularly useful with instances that change names between runs and that answer to a naming pattern in dynamic environments (e.g., Hyper-V network adapters, IIS process names etc.).
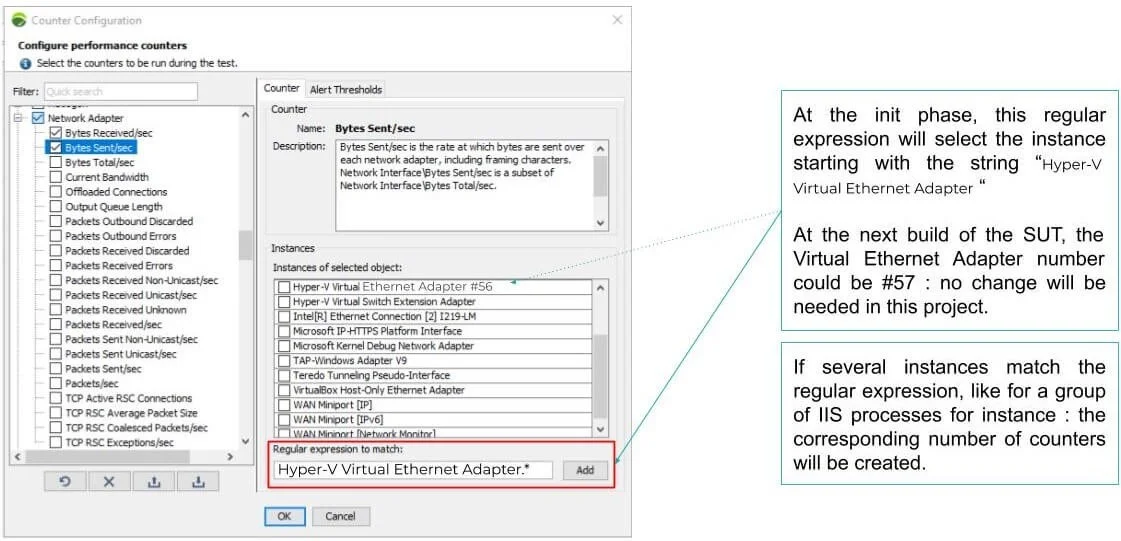
The regular expressions are resolved during the initialization phase of the run to define the counters list.
Test providers’ settings from the settings panel.
Cluster events now appear in the logs.
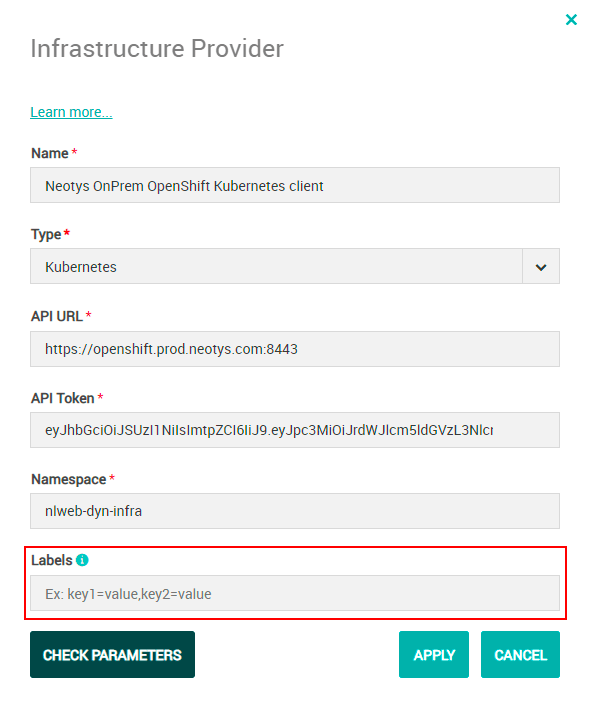
Customize labels for the orchestrator of your choice: this allows for integration with all your enterprise systems that use labels as criteria, such as self-service or billing systems.
Find ready-to-use examples of Bamboo CI configurations among the growing library of pre-configured NeoLoad Python CLI examples (Azure DevOps, Gitlab, AWS CodePipeline, etc.). Use Bamboo as-code V1 and V2 scripts to connect to your NeoLoad platform, run your tests, and automatically decide to pass/fail your CI pipeline according to your SLAs.

Boost release confidence with AI driven test creation that focuses...

Forrester finds Tricentis drastically improves testing speed,...

See how Agentic Test Automation can help you boost productivity,...
Agentic Performance Testing brings autonomous, expert-level...

When Oracle gets more complex, your testing must keep up. These six...
Watch this webinar to hear two Tricentis experts discuss what’s...