
Agentic Test Automation in action
AI-powered testing assistant purpose-built for Tosca to enable...
Discover how observability is crucial to ensuring an optimal user experience, and why bad application performance impacts online businesses.
By Stijn Schepers, Senior Performance Engineer, Accenture
December 18, 2016. I remember this day as if it were yesterday. The day I lost my son in the zoo. Tomas was only two years old. Just for one single second, I lost sight of this little active toddler. My brain went into panic mode as I already imagined him to be sneaking into the enclosure with the lions. I immediately approached the staff at the zoo and asked for help. I provided a description of Tomas: boy, two years old, does not talk much, wearing black shorts and a yellow T-shirt. Five minutes later the staff told me that they had found a boy. But the boy did not fit the description. Tomas was wearing a blue T-shirt and yellow shorts. Luckily, as soon as Tomas saw me, he jumped into my arms and gave me a big cuddle. This could have been way more embarrassing.
Although I thought I knew what Tomas was wearing, this was not the case! I did not watch closely to see what he was wearing. I did not “observe” him before taking him to the zoo. I believe that this personal story can be translated into ICT [information and communication technologies] systems. Often we look at metrics without really understanding what these metrics mean or how they should be interpreted.
For performance engineering, I’ve created a definition of to observe:
To watch the behavior of an application carefully using “response time” as a primary metric and “resource utilization” as a secondary metric — with the prime goal to understand the digital end-user experience and to take action if the experience is unacceptable or degrading pro-actively
When you monitor the performance of an ICT system, you must look at the end-user experience. There is no metric more useful than understanding the real performance an end user is experiencing. Any other metric is secondary. It may well be that the CPU of an ICT system is nearly 100%. Still, if this does not impact end-user experience (online, batch), it is less critical then when user experience is degrading and impacting revenue, your company brand, and loyalty. That’s why I like to refer to the two pillars of observability:
These pillars are the foundation of great user experience if observed correctly, and proactive actions are taken when degradation happens.
When looking at an application performance monitoring (APM) dashboard, it is key that you understand the context and know what is happening with the application. This is both from a business perspective and from a release point of view. The risk to impact end-user experience is higher when change is made to an ICT system. Change can be an application release, an infrastructure upgrade, a configuration change, a database modification, or even a network change. Being able to track any (planned or unplanned) change and include these changes into a monitoring dashboard provides an extra dimension to your metrics. Unfortunately, I have not seen any APM provider embedding release information into their APM dashboards as a built-in feature, which is so essential to provide context and to be able to observe application behavior.
Sometimes the business itself is the most significant risk for lousy application performance. Typically when an announcement is made to the media (TV, online, social media, or newspaper), this can cause a lot of interest in the company. If these announcements are planned, would it not be significant that the IT department be aware of this? So proactively, the department can up-scale, or the operations team can keep a closer eye (read: observe) on the performance of the ICT systems?
Let me introduce a new type of performance test: the DALPA-O test. A DALPA-O test is a Daily Automated Load test in Production with APM enabled for Observability. Testing in production is risky, but it has value as well. “Production” always has the correct version of software and configuration, the right volume of data, and does not cost tons of money to set up, as it is already there. That’s a bonus! The production environment has monitoring tooling (APM like Dynatrace, AppDynamics, or New Relic) installed and configured to observe application behavior. Most business applications are not heavily used 24×7. There may be windows during the day or night that the application is hardly used at all. This provides an opportunity to use the live production environment for the execution of a load test. The results can be trusted, and if you do this daily —in a fully automated way — you can get a lot of information that supports the observation of application performance.
At one financial client, we have been executing DALPA-O tests for the past few months. As the load test tool we use Tricentis NeoLoad, and the APM software is AppDynamics. See the image below for an overview.
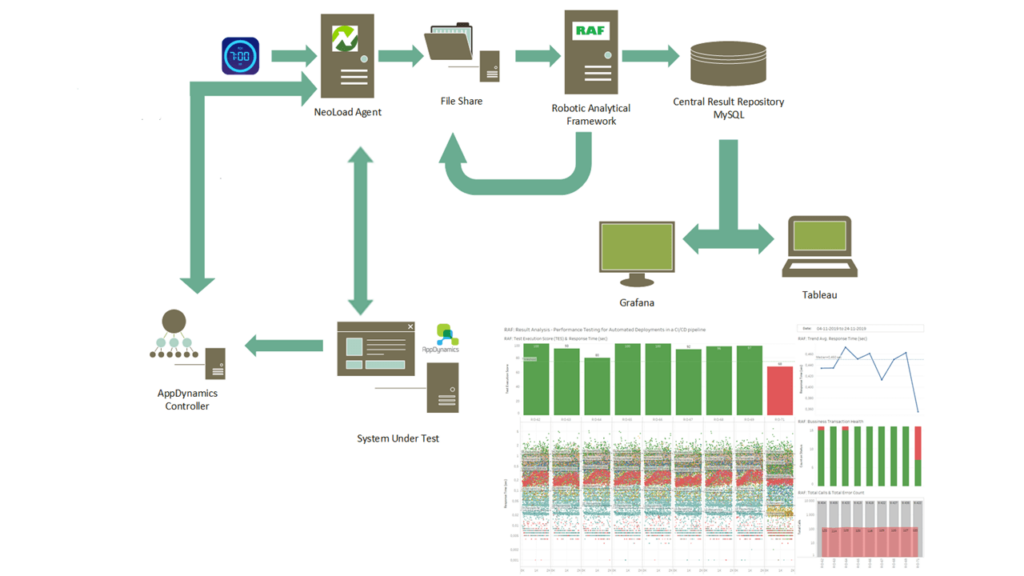
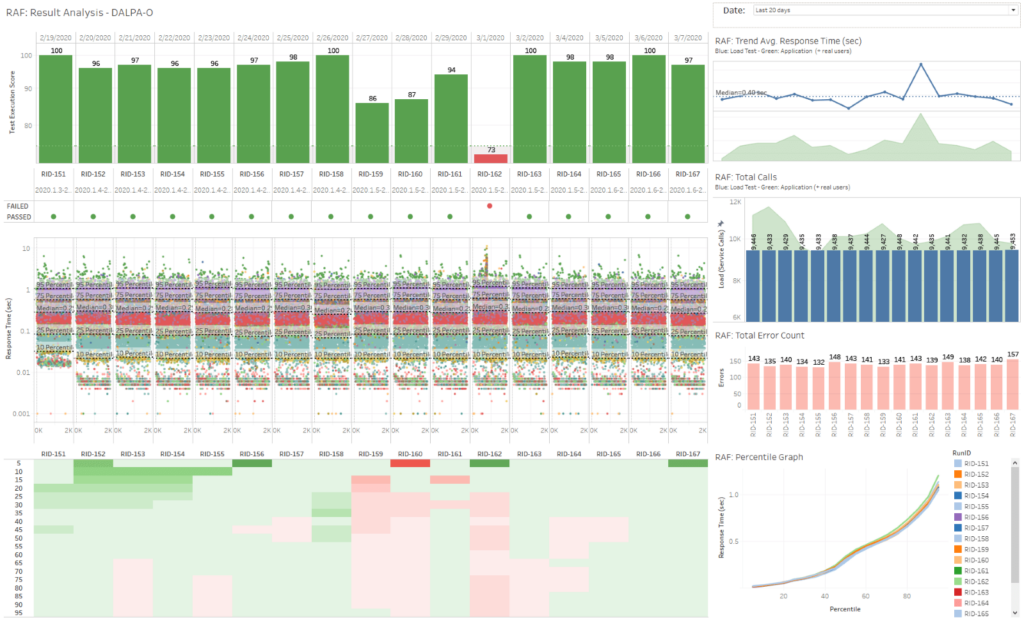
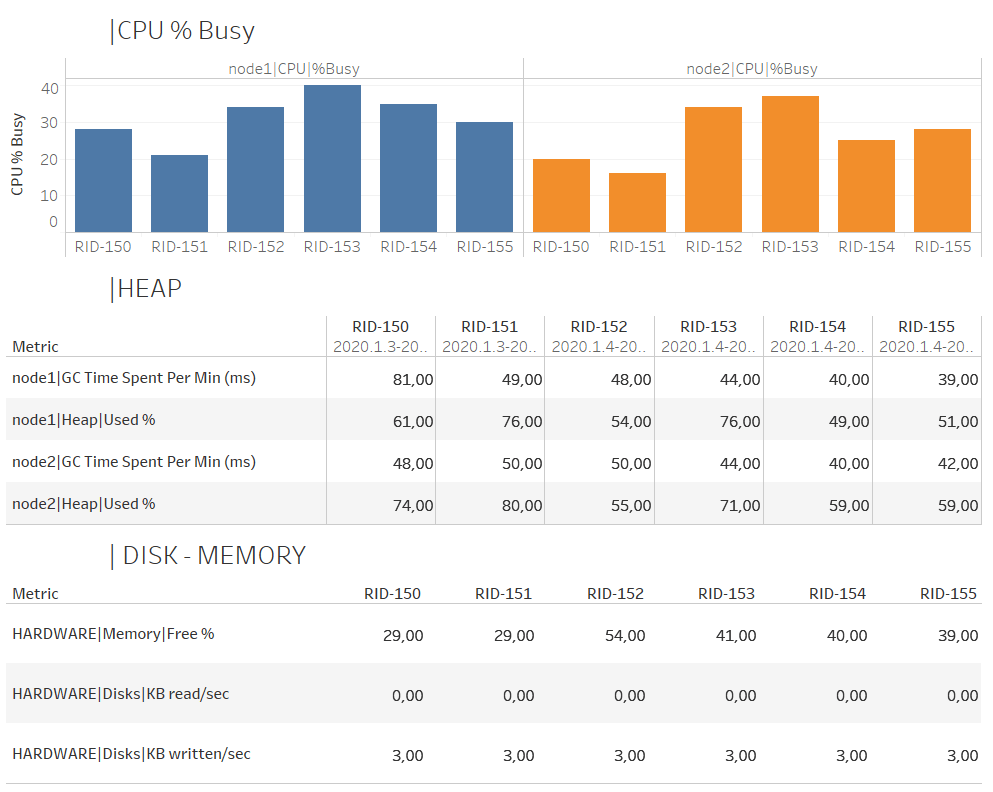
Every morning at 7 a.m., we automatically execute a load test in NoGui mode in live production and export the raw data into a file share. Raw data can be defined as every single measurement of response time, i.e., not relying on averages or aggregation. Analyzing a load test based on raw data provides you with the true story of application performance. We use the Robotic Analytical Framework (RAF) to push the results into a central data repository. RAF adds the version-ID of the software and a RunID (the unique identifier of test execution) and automatically analyzes the results by comparing the raw data of the last run with one or more previous execution runs with a status “passed.” We use the Tableau business intelligence software. Tableau dashboards — which are linked to the analysis results generated by RAF — provide us with observation insights around application performance. The image below shows the main panels. Graphs include raw data, trend lines, and percentile graphs. Every specific chart provides a different view of the data and can reveal changes in application behavior. The Test Execution Score, calculated by the RAF framework, is what executives like, as it is a simple metric to understand. The higher the number, the better the outcome of the automated load test. With these dashboards, we have covered the primary pillar of observability: response metrics.
For the second pillar, “resource metrics,” we created two solutions.
1. Integration of NeoLoad with Dexter
We integrated Tricentis NeoLoad with Dexter — a Data Extraction & Enhanced Reporting framework — to dump resource metrics from AppDynamics, which is the APM solution that monitors production, into flat files. As we execute this load test every day, we have 365 datasets with a collection of a wide range of resource metrics. Dexter also provides us with flame graphs, which tell us in which code the most time has been spent.
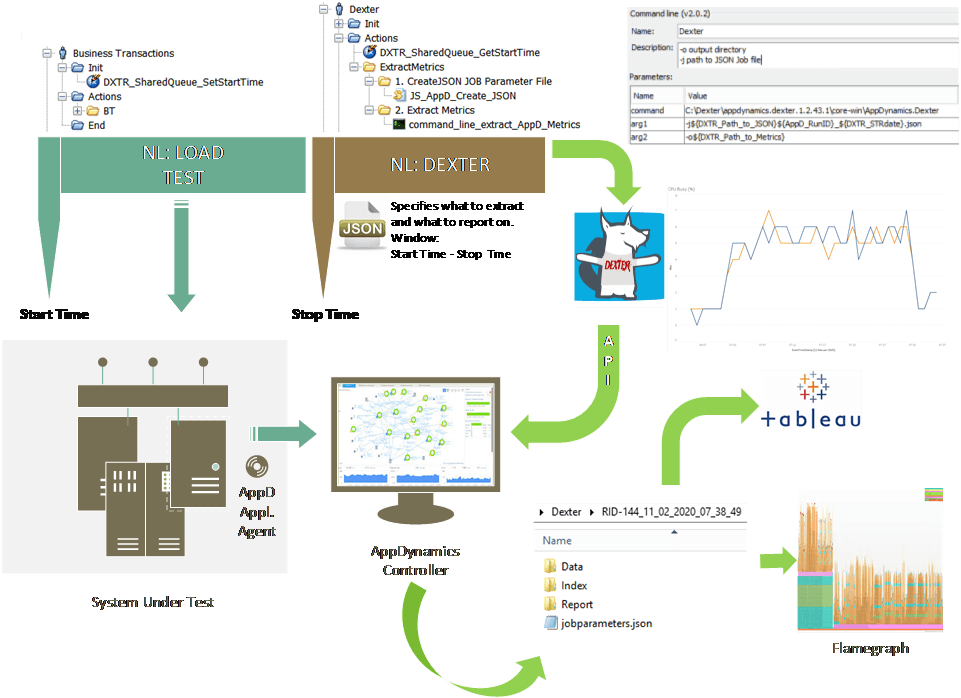
The image above provides a high-level view of how to integrate NeoLoad with Dexter. The user path (also referred to as script) “Business Transactions” is the script that we use to mimic a peak load test in production. Before starting the test, we automatically set the start time, which is a “date-time” variable. We use a shared queue to pass this variable from one user path, “Business Transactions,” to a second user path, “Dexter.” This way, we can specify the specific time range for metric collection. This time range is set in the JSON file, referred to as the job parameter file. In the job parameter file you specify:
In NeoLoad, a JavaScript generates this JSON file. With a command-Llne action, we call Dexter and specify with two arguments the path to the JSON file and where to output the resource metrics.
(See here for more information about Dexter. Or download here.)
2. Integration of NeoLoad with AppDynamics using REST calls
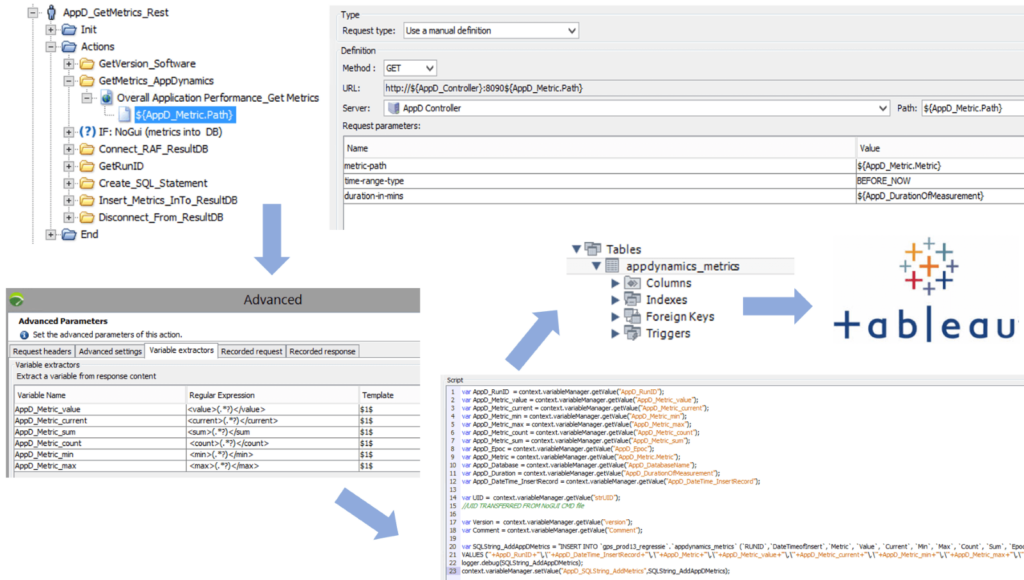
We created a NeoLoad User Path that calls specific metrics (CPU, memory, disk I/O) from AppDynamics and adds these values into the central result repository. With Tableau, we can create secondary dashboards that display resource utilization.
Observation is crucial to make sure that your customers are happy end users. Lousy performance and unavailability (error pages — we all hate these!) are detrimental for online businesses and result in lost revenue, decreased loyalty, and harmful impact to your brand.
A performance tester can support observability by the creation of automated daily load tests in production. Smart frameworks (like RAF) drive the automatic collection and analysis of response metrics. Intelligent dashboards –—created with BI tools (like Tableau) — are the eyes of observability. Providing context into these dashboards by including version number will help with the analysis if a decrease of response time happens. Having resource utilization metrics in the finest granularity available as secondary metrics supports the analysis when issues occur.
Learn more about continuous performance testing and how to deliver performance at scale.
Learn more about continuous performance testing and how to deliver performance at scale.
AI-powered testing assistant purpose-built for Tosca to enable...

We’re extending our proven expertise in test automation with...
Learn how to build a Workday testing strategy that minimizes...
Connect NeoLoad with Datadog to unlock real-time observability and...
Learn how a top European bank drove Agile transformation, tackled...