
Introducing Agentic Performance Testing: Autonomy meets expertise
Unveiling new AI-powered solutions that automate performance...
The latest Tricentis Analytics release includes a new Tosca custom reporting app, master visualizations and more.
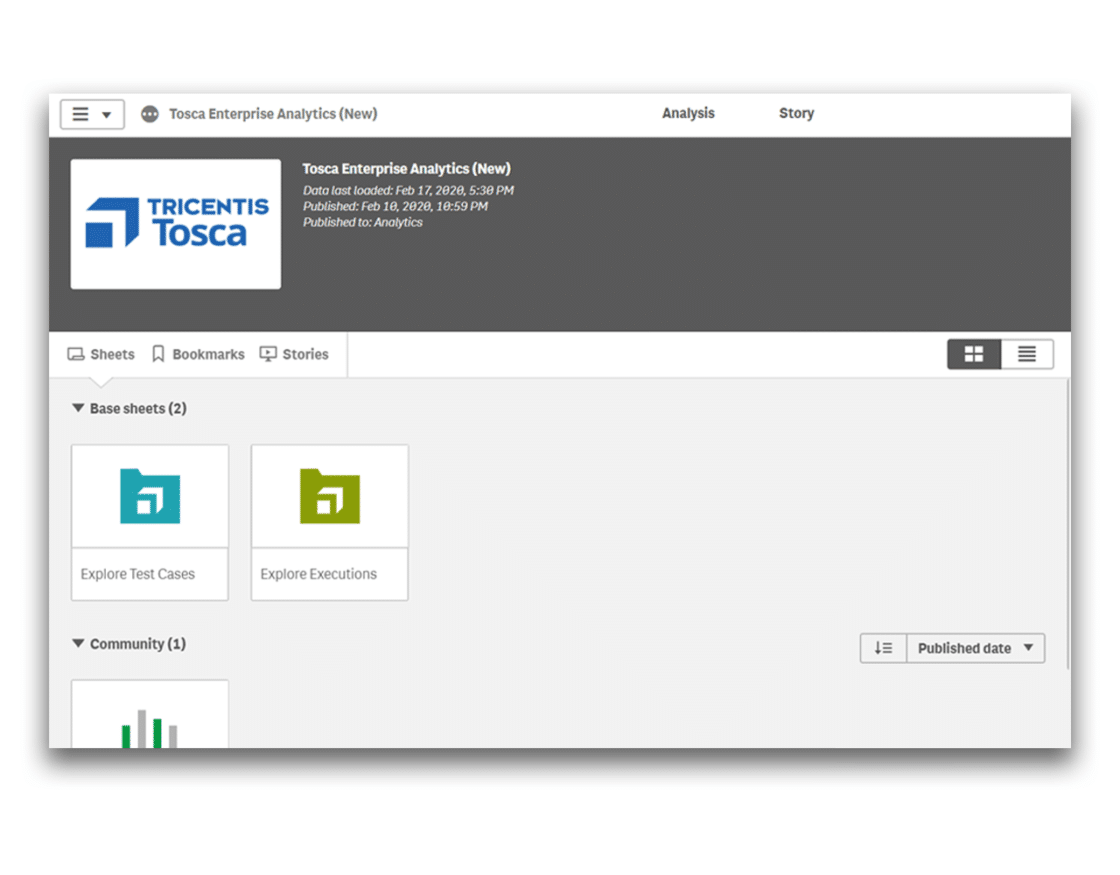
This February’s Tricentis Analytics 1.5 release introduces a fully revamped Tosca reporting application, Tosca Enterprise Analytics, which has been reformatted for improved custom reporting. Additional enhancements include new master visualizations and base sheets, backward compatibility for Tosca users and more. Read on for the details.
We are continuing to add more custom reporting capabilities for both qTest and Tosca users. With this release, we have launched a brand new Tosca Enterprise Analytics application. This new application has been reformatted from the old version to include a brand new data model. This new model allows you to build more custom reports, more easily, against your Tosca data.
The new Tosca Enterprise Analytics application also comes with new out-of-the-box base sheets and master visualizations that make it faster and easier to build a report, including:
With this latest release, we’ve included an enhanced installer and backward compatibility with older versions of Tosca. Previously, users had to upgrade their Tosca version to use the newest versions of Tricentis Analytics. For more information on compatibility, please refer to the release notes.
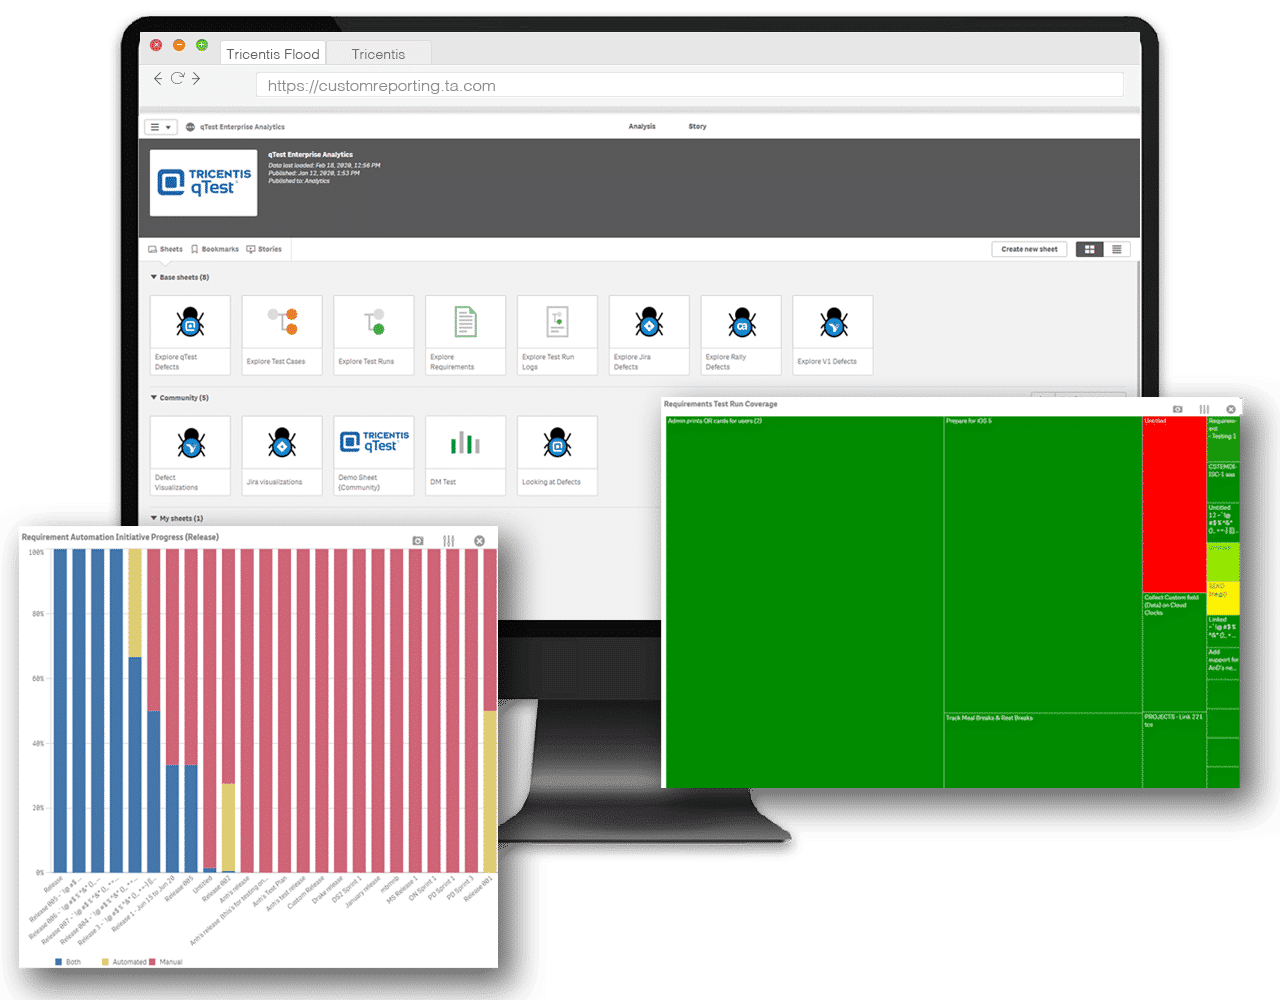
In our release last November, we added 16 new Master Visualizations to the qTest Enterprise Analytics Application. But we didn’t stop there. We have been very busy creating brand new reporting functionality for the qTest Enterprise Analytics application. With this release, we have added four new master visualizations that will make your custom reporting even easier than before, including:

Learn more about how to scale, orchestrate, and accelerate test automation for complete visibility into your testing process.
Learn more about how to scale, orchestrate, and accelerate test automation for complete visibility into your testing process.
Unveiling new AI-powered solutions that automate performance...
Forrester reports: SAP customers cut costs, speed releases, and...
See our coordinated system of AI agents and the AI Workspace they...

Forrester finds Tricentis drastically improves testing speed,...
Introducing EPT performance testing for SAP, with a demo showcasing...
Discover how quality intelligence and agentic AI transform SAP QA,...