Tricentis qTest

Visual reporting for Agile testing

qTest Insights gives Agile teams a single interface for analyzing application health, quality, and release readiness across projects and teams.

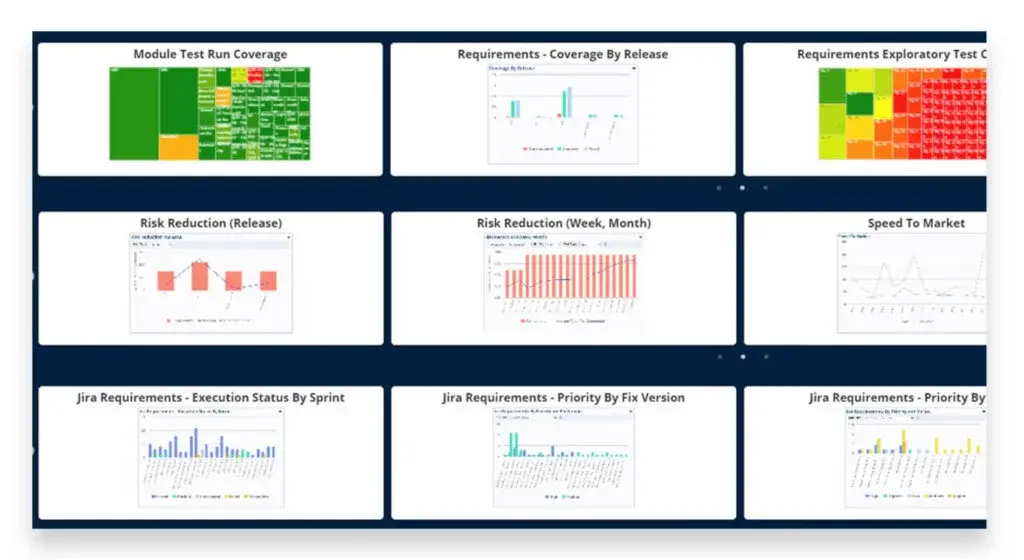
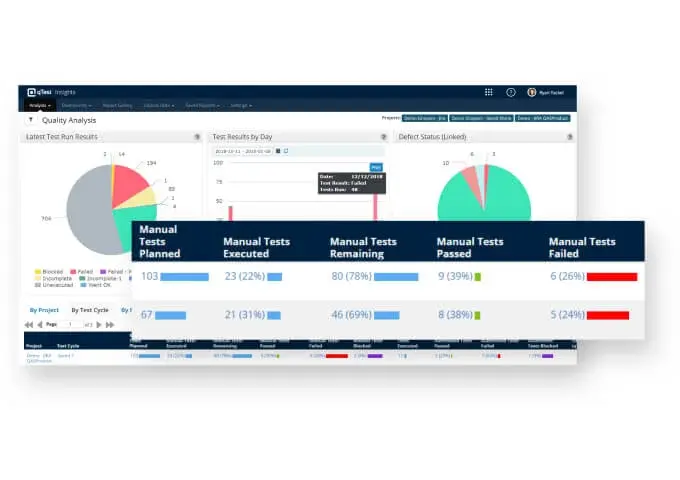
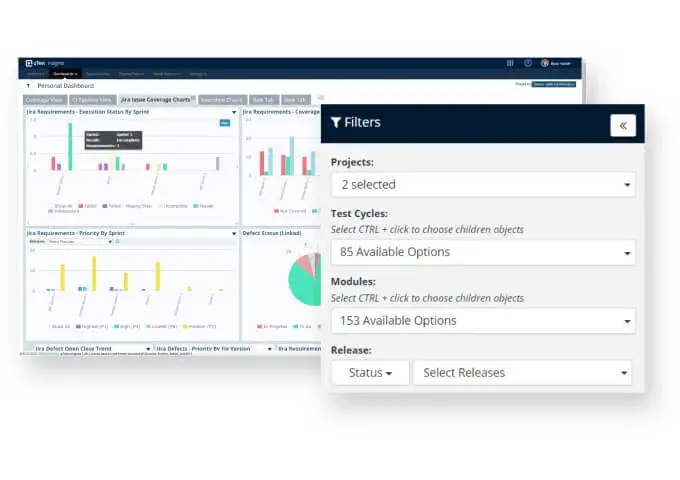
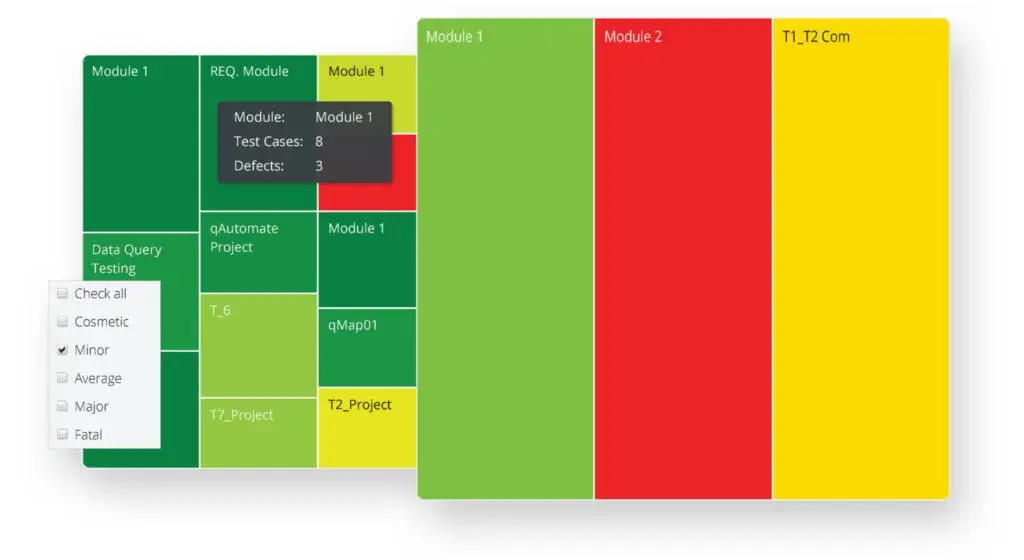
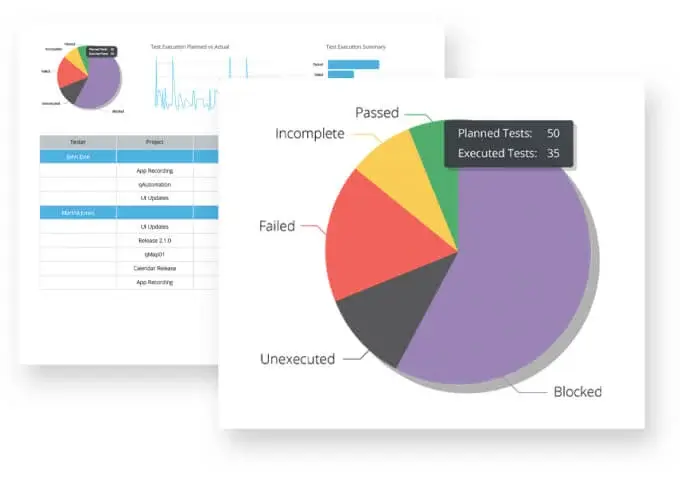
Out-of-the-box and custom reports

Leverage out-of-the-box report templates for quality, coverage, velocity analysis, or build custom reports and dashboards to report on the metrics that matter most to your business. Create pie charts, bar graphs, scatter plots, and many more.

Standardize QA reporting

Offer testers a single interface for accessing test data, assessing release readiness and creating reports. Create a common set of dashboard reports that can be used by team leads, managers, and directors across multiple projects, methodologies, and teams.

Custom dashboards

Create cross-project reporting with actionable test metrics. Tabs let you create multiple dashboards for different projects or teams.

Visual heat maps

Visualize your data with interactive heat maps. Interactively sort and filter data by object type and severity to quickly identify issues, and drill down for additional details, so you can quickly find and address risks.

Interactive charts

Gain valuable insights both within and across projects that help you improve application quality immediately and over time. Hover over charts to view specific test metrics. Zoom in to dynamically adjust the view, or click on a chart to view and download the data.

Continuous testing for SAP

Modernize SAP business process testing with the most comprehensive automated testing solution for SAP technologies.

Replace Quality Center

Accelerate release cycles with modern test management and seamless integrations across the software delivery pipeline.