
Introducing Agentic Performance Testing: Autonomy meets expertise
Unveiling new AI-powered solutions that automate performance...
Learn about new Forrester research on how DevOps leaders use and value 75 common quality metrics. Are you relying on “overrated” metrics or overlooking “hidden gems”?
The way that we develop and deliver software has changed dramatically in the past 5 years—but the metrics we use to measure quality remain largely the same. Despite seismic shifts in business expectations, development methodologies, system architectures, and team structures, most organizations still rely on quality metrics that were designed for a much different era.
Every other aspect of application delivery has been scrutinized and optimized as we transform our processes for DevOps. Why not put quality metrics under the microscope as well?
Are metrics like number of automated tests, test case coverage, and pass/fail rate important in the context of DevOps, where the goal is immediate insight into whether a given release candidate has an acceptable level of risk? What other metrics can help us ensure that the steady stream of updates don’t undermine the very user experience that we’re working so hard to enhance?
To provide the DevOps community an objective perspective on what quality metrics are most critical for DevOps success, Tricentis commissioned Forrester to research the topic. The results are published in a new 55-page ebook, Forrester Research on DevOps Quality Metrics that Matter: 75 Common Metrics—Ranked by Industry Experts.
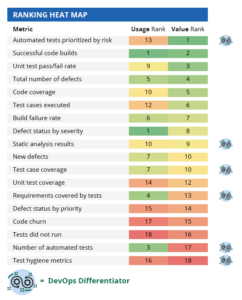
For each category of quality metrics, we came up with a heat map showing usage vs. value rankings. For example, here is the heat map for the Build category metrics.
We also plotted the data for each metric into a quadrant with 4 sections:
For example, here is the quadrant for Build category metrics:

The ebook provides both heat maps and quadrants for all 4 categories, a quick look at each of the 75 metrics, per-category and overall analyses, and a few fun lists. Here’s a preview…
The following metrics are not commonly used (even among DevOps experts), but are ranked as extremely valuable by the select teams who actually measure them:
DevOps experts/leaders measure the following metrics significantly more than DevOps laggards measure them:
The following metrics are the most frequently used (overall) by DevOps experts/leaders:
The following metrics are the most highly-valued (overall) by DevOps experts/leaders:
Vincent Lussenburg, Director of DevOps Strategy at XebiaLabs, offered the following commentary on the findings:
“I’m happy to see that, in the survey, Release Readiness is identified as a critical metric to DevOps success. We know firsthand Release Readiness is a differentiator for our customers—it allows them to make their delivery process more efficient, reduce risk, and deliver high-quality software fast.
Our DevOps platform integrates with an organization’s existing tools, such as Tricentis Tosca, and builds in features that help IT teams ensure their releases are solid before making it to Production. For example, did all the critical tests run and succeed? Do the test failures that occur present a release risk? Were environmental problems triaged, issues created for more permanent fixes, and root causes recorded? XebiaLabs automates checks like these all the way through the pipeline and visualizes release risk from various perspectives, including but not limited to your testing campaigns. We even help you predict which releases are most vulnerable to failure.”
Unveiling new AI-powered solutions that automate performance...
Forrester reports: SAP customers cut costs, speed releases, and...
See our coordinated system of AI agents and the AI Workspace they...

Forrester finds Tricentis drastically improves testing speed,...
Introducing EPT performance testing for SAP, with a demo showcasing...
Discover how quality intelligence and agentic AI transform SAP QA,...