
How NeoLoad is Different from JMeter
NeoLoad customers often tell us the best part of using the product is...
Explore NeoLoad Dynatrace integration for advanced performance testing. Configure Dynatrace, set up API tokens, and enable seamless integration in NeoLoad.
The integration is predicated on Dynatrace’s ability to monitor the systems that NeoLoad will exercise during a performance test. Installation of the Dynatrace OneAgent to monitor the applications under test is a necessary first step in this process. Typically, this applies to pre-production systems found in the development and QA environments.
These platforms can be quite ephemeral, being created and destroyed with high frequency as part of a Continuous Integration and Continuous Delivery process. Implementing the creation of application infrastructure as code is a recommended best practice to ensure consistency of these platforms from version to version, as well as automating the installation of the Dynatrace OneAgent and the integration of that agent into the overall monitoring platform. By automating this process, you gain several key benefits, not least of which is that the platform is ready for performance testing. The NeoLoad test results will include detailed metrics collected from Dynatrace.
Additionally, you need to manually put a tag on a Dynatrace service at the traffic entry point of your application, typically your web front servers or proxies. From there, the integration will auto-tag all connected hosts, services and processes in the Dynatrace smartscape.
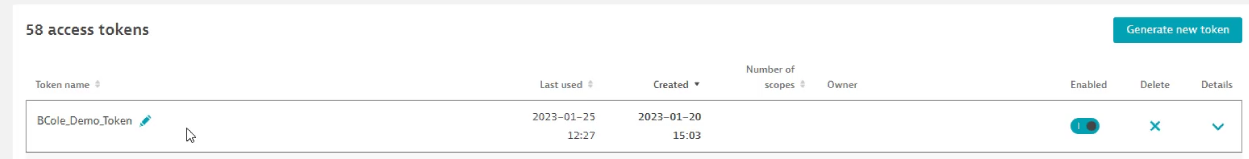
Within the Dynatrace web interface, select Manage → Access Tokens. Here you can create a new API token that you will then provide to NeoLoad. This token needs to have the correct permissions in order to access the application under test, so ensure that you create it with the correct scope.
The following access permissions must be defined in the Dynatrace API token to allow NeoLoad to have full access to all integration functions:
API Access Permission:
Access problem and event feed, metrics and topology
Purpose:
To retrieve and send metrics
API Access Permission:
Capture request data
Purpose:
To identify traffic
API Access Permission:
Read configuration
Purpose:
To create anomaly detection rules
API Access Permission:
Write configuration
Purpose:
To create anomaly detection rules
API Access Permission:
Read entities using API V2
Purpose:
To retrieve entities to monitor
API Access Permission:
Write entities using API V2
Purpose:
To delete the tags created by NeoLoad at the end of the test
While it’s not required, you can add filters to categorize information coming from a NeoLoad performance test. When Dynatrace Integration is enabled, NeoLoad will send an additional header on all requests that it sends. This allows you to easily isolate the traffic coming exclusively from NeoLoad. The following request attributes will be automatically created by NeoLoad inside your Dynatrace instance:
Header Property:
PC
Request attribute name in Dynatrace:
NeoLoad requests
Value:
The name of the page
Header Property:
SN
Request attribute name in Dynatrace:
NeoLoad_ScenarioName
Value:
The name of the user path
Header Property:
NA
Request attribute name in Dynatrace:
NeoLoad_Transaction
Value:
The path to the transaction
Header Property:
GR
Request attribute name in Dynatrace:
NeoLoad_Zone
Value:
The zone of the load generator
You can also create your own request attributes beyond these automated ones to filter the traffic with more granularity:
Header property:
SI
Value:
This value is always NeoLoad
Header property:
VU
Value:
The ID of the virtual user that executes the request
Header property:
ID
Value:
The unique ID of the request. It remains constant for the same request in the same zone and the same population.
Header property:
TE
Value:
The project name, scenario name, and Test Result ID, separated by a dash.
For example, a header sent to Dynatrace could be:
X-Dynatrace-Test: SI=NeoLoad;VU=0;SN=MyUserPath;PC=/page.html;ID=8;NA=Actions.transaction.;GR=Default zone;TE=Sample_Project-scenario1-09aab63a-bf17-4505-9d70-f6c267055b89
Dynatrace integration is compatible with RealBrowser user paths along with protocol user paths. When you enable Dynatrace Integration on a RealBrowser test, the values for PC, ID, and NA will all be empty.
To enable Dynatrace Integration within NeoLoad, click Edit → Preferences → Project Settings → Dynatrace. Then select the Enable Dynatrace information checkbox, and enter the URL of your Dynatrace instance and the API Token value you created in the Access Tokens step earlier.

Once this step is complete, you can add a Dynatrace monitoring agent to your project. Do this by selecting Design → Monitors & Connectors → New monitored machine, then select the option to create a Dynatrace Monitor.
What is happening here is that NeoLoad will create a monitoring agent, and that agent will – using the URL and API token defined in your preferences – reach out to Dynatrace during a test execution to retrieve metrics. At the same time, as the test executes, NeoLoad will include header information in each request sent as part of the test that Dynatrace will use to automatically configure dashboards for the performance test as it occurs.
This integration allows disparate groups – the performance engineering team and the IT operations team – to view performance test results in their preferred solution of choice. The performance engineers, using NeoLoad, have all of the Dynatrace metrics embedded in their test results. The operations team, using Dynatrace, have all the NeoLoad metrics added to their view. Both teams can collaborate and analyze the results using their existing expertise with their preferred software solution.
You may have specific alert thresholds that you would like to specify as part of a performance scenario. Instead of forcing the performance engineering team to configure them within Dynatrace, you can instead create them in NeoLoad as part of the test scenario and pass that information automatically to Dynatrace as part of the integration.
To enable Anomaly Detection within NeoLoad, select Runtime → Scenario Advanced… → APM. Here you can create scenario-specific anomaly detection rules that are saved inline with the scenario. This aligns the detection of variances with the scenario designed to test them, and the triggered events then display in Dynatrace.
Setting up Dynatrace integration with NeoLoad allows performance engineering teams to gain a level of insight and information on the system under test that is hard to achieve otherwise. As application infrastructures increasingly leverage newer technologies such as Kubernetes, elastic computing, and cloud platforms, monitoring applications under test is becoming increasingly complex. By simply offloading that work to Dynatrace, not only do you gain superior monitoring capabilities that can automatically detect relevant platforms used in your test, but you also expose your performance testing efforts to a broader audience and enable better collaboration between teams. For an IT Operations team, the visibility of the performance characteristics of an application under test – well before it is deployed into their production environment – can offer a great deal of confidence in the delivery process and smooth deployment into production.
For the performance engineering teams, using Dynatrace for your performance testing means the difference between knowing there is a problem during the login process, and knowing there is a problem in the login process because the Kerberos message was delayed on the authentication server due to a CPU constraint caused by poorly configured resource caps on the Kubernetes cluster that manages it. It is a dramatic difference in the quality of the analysis capabilities available to you, and if the deployment of OneAgents can be automated as part of the delivery process, you will always have access to it.
Learn more about continuous performance testing and how to deliver performance at scale.
Learn more about continuous performance testing and how to deliver performance at scale.